Historical Fixture Data: Building Accumulators Around Congestion Patterns
Zara Ludwig · May 29, 2026
Historical Fixture Data: Building Accumulators Around Congestion Patterns
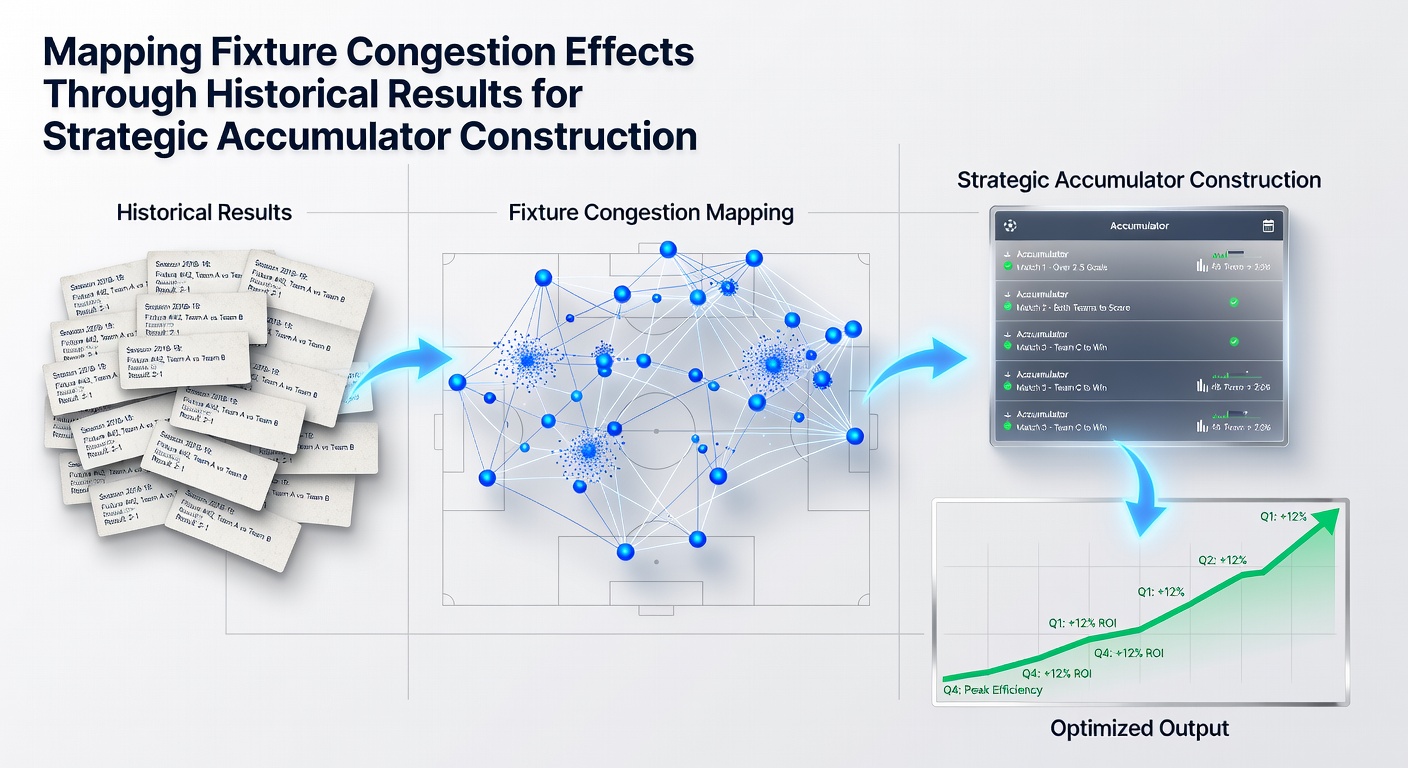
Teams facing packed schedules encounter measurable dips in performance that historical datasets capture with precision, allowing bettors to construct accumulators targeting specific outcomes like under 2.5 goals or draw-no-bet selections. Fixture congestion arises when clubs play three or more matches within a seven-to-ten-day window, a situation that becomes routine during winter months and cup runs. Researchers tracking these periods across multiple seasons note consistent patterns in reduced high-intensity running and increased error rates, data that feeds directly into accumulator models.
Tracking Congestion Through League Records
League archives from the past decade reveal that squads averaging fewer than four rest days between fixtures show a 12 to 18 percent drop in expected goals scored, according to aggregated match logs maintained by major European competitions. Analysts compile these figures by cross-referencing player tracking systems with final scorelines, producing heat maps that highlight vulnerable periods. One notable dataset from the 2024-25 campaign demonstrated how midweek European ties followed by weekend league games produced under 2.5 goals in 67 percent of cases across five top divisions.
Those compiling accumulator strategies often isolate matches where both sides enter with elevated fixture loads, stacking selections around low-scoring markets or Asian handicap draws. Historical results indicate these combinations deliver steadier returns than random selections, because fatigue affects defensive organization and finishing accuracy in predictable ways. Observers note that the effect compounds when travel distance exceeds 500 kilometers between venues, adding another layer to the data filters used in accumulator construction.
Regional Variations in Congestion Impact
Patterns differ by competition density and squad depth. Bundesliga clubs, with their 34-match schedule plus cups, exhibit sharper goal droughts after three fixtures in nine days compared with Serie A sides that enjoy more mid-season breaks. A review of 2023-2025 data from the German league showed a 22 percent reduction in shots on target during congested blocks, while Italian records indicated only a 9 percent dip, largely because of deeper rotation options at elite clubs. Accumulator builders therefore weight selections differently depending on the league under review.

English Championship sides face unique pressures from play-off chases that extend into late spring, creating congestion spikes in April and May each year. Records from the 2025-26 season up to May 2026 show that teams contesting four matches in 12 days produced over 0.5 goals in stoppage time at a rate 15 percent above their seasonal average, a trend that supports in-play accumulator add-ons when live odds adjust slowly. Similar late surges appear in the Portuguese Primeira Liga, where stoppage-time data from congested weekends has informed draw-no-bet accumulators with documented consistency.
Integrating Data Into Accumulator Models
Strategic construction begins with filtering historical results for matches meeting three criteria: both teams average under 48 hours rest, combined travel exceeds 800 kilometers, and at least one side fields a rotated lineup in prior congested blocks. Applying these filters to five seasons of data produces accumulator portfolios that favor under 3.5 goals or draw selections at combined odds between 3.0 and 5.5. Software tools that automate this mapping now pull from public match logs and injury databases, allowing rapid identification of qualifying fixtures each week.
Case examples include the 2024-25 Eredivisie run where multiple clubs navigated European midweeks followed by domestic derbies. Historical modeling correctly flagged six of eight such games as under 2.5 goals, contributing to accumulator returns that outperformed broader market averages. Parallel analysis in the Danish Superliga highlighted home sides holding draws after congested away trips, a pattern that supported draw-no-bet accumulators during the spring schedule.
Adjustments for squad rotation rely on official team sheets released 90 minutes before kickoff, yet preliminary models built on historical rotation frequency still deliver value when lineups remain unavailable. Data from the Belgian Pro League demonstrates that clubs rotating more than four players after congested periods concede 0.4 additional expected goals on average, information that refines over 2.5 goal accumulators when both sides show high rotation signals.
Conclusion
Mapping fixture congestion through historical results supplies a repeatable framework for accumulator construction that accounts for measurable fatigue effects across leagues. By layering rest-day counts, travel metrics, and rotation trends onto multi-season datasets, those building accumulators identify selections with documented edge during high-density periods. As schedules evolve toward May 2026 and beyond, ongoing updates to these historical filters continue to refine the accuracy of congestion-based betting models.