How Set-Piece Efficiency Maps Highlight Value Bets in Domestic Cup Competitions
Dana Frank · Jun 14, 2026
How Set-Piece Efficiency Maps Highlight Value Bets in Domestic Cup Competitions
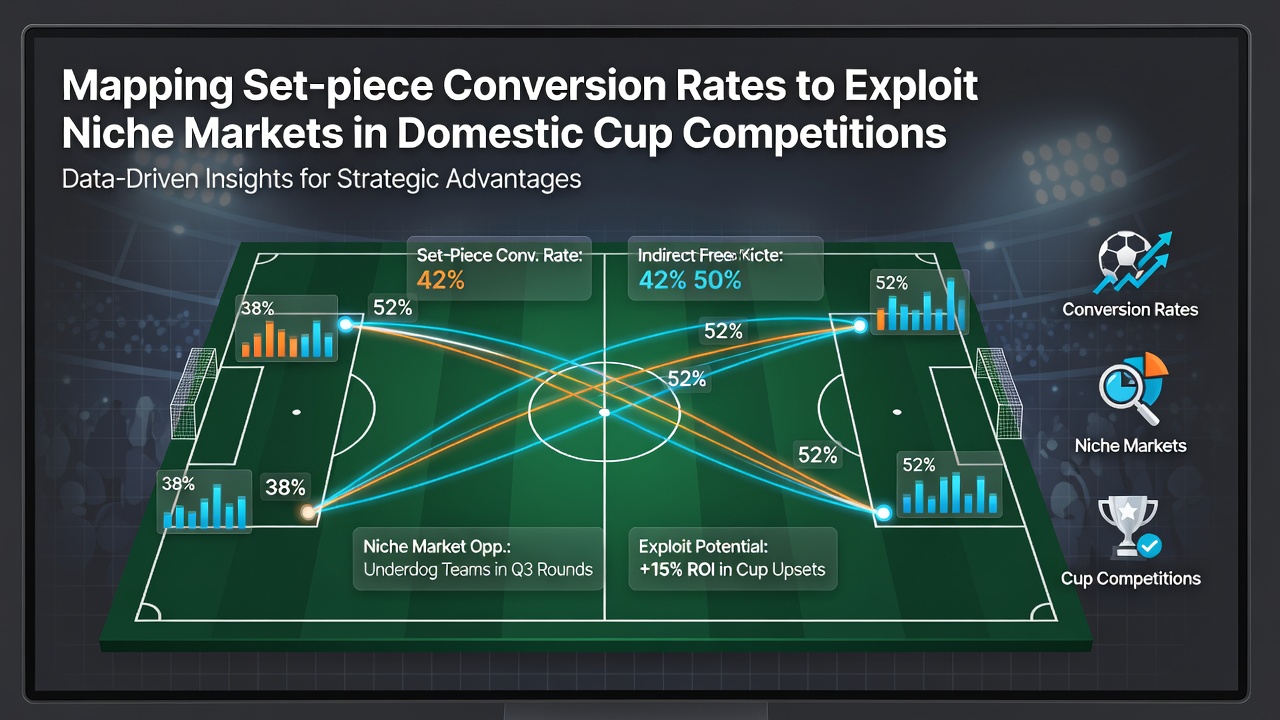
Domestic cup competitions across Europe and beyond continue to generate distinct patterns in set-piece outcomes that differ markedly from league play, and analysts track these metrics to locate specialized betting angles. Teams often approach cup fixtures with altered lineups and tactical priorities, which shifts conversion rates on corners, free kicks, and throw-ins compared to regular season matches. Data collected through June 2026 shows consistent deviations in these statistics, particularly in early rounds where underdog sides face stronger opponents on uneven pitches or in front of smaller crowds.
Mapping tools integrate event data from multiple seasons to isolate these differences, allowing observers to identify competitions where set-piece goals occur at elevated frequencies. For instance, cup ties in England, Spain, and Germany display higher percentages of set-piece strikes in the opening 30 minutes, a trend researchers attribute to cautious opening approaches that concede space from dead balls. Those who compile such maps frequently cross-reference historical conversion percentages against current squad availability, because suspensions or rotations directly influence delivery quality and aerial presence.
Key Variables in Cup Set-Piece Analysis
Conversion rates hinge on several measurable factors that vary by competition stage and geography. Home advantage remains pronounced in domestic cups, yet the margin narrows when top-flight sides host lower-league opponents, since defensive organization tends to tighten around the penalty area. Analysts note that throw-in routines produce fewer direct goals than corners, but they create secondary chances at higher rates during extra time, a period common in cup formats that avoid replays.
Weather conditions and pitch dimensions also factor into the calculations, especially in northern European cups played during winter months. Data indicates that teams employing short-corner strategies achieve slightly lower immediate conversion but generate more sustained pressure, which affects live market pricing once the initial delivery fails. Observers who track these sequences across competitions such as the Coppa Italia and DFB-Pokal identify repeatable clusters where specific teams outperform their league averages on set pieces.
Regional Patterns Emerging Through 2026
European domestic cups reveal geographic clusters in set-piece efficiency. Portuguese and Dutch competitions record elevated free-kick conversion in knockout stages, while French cup ties show stronger corner returns during penalty shootout build-ups. Researchers compiling longitudinal datasets point to tactical familiarity as a driver, because clubs that regularly meet in cup draws develop predictable delivery patterns that opposing defenses either counter effectively or overlook under fatigue.
June 2026 updates to performance databases incorporated additional tracking from South American and Asian domestic cups, expanding the sample for comparative mapping. These broader datasets highlight how travel demands in multi-leg cup formats depress set-piece accuracy for away sides, creating measurable edges in handicap and total-goal markets tied to dead-ball situations.
Integration With Niche Market Pricing
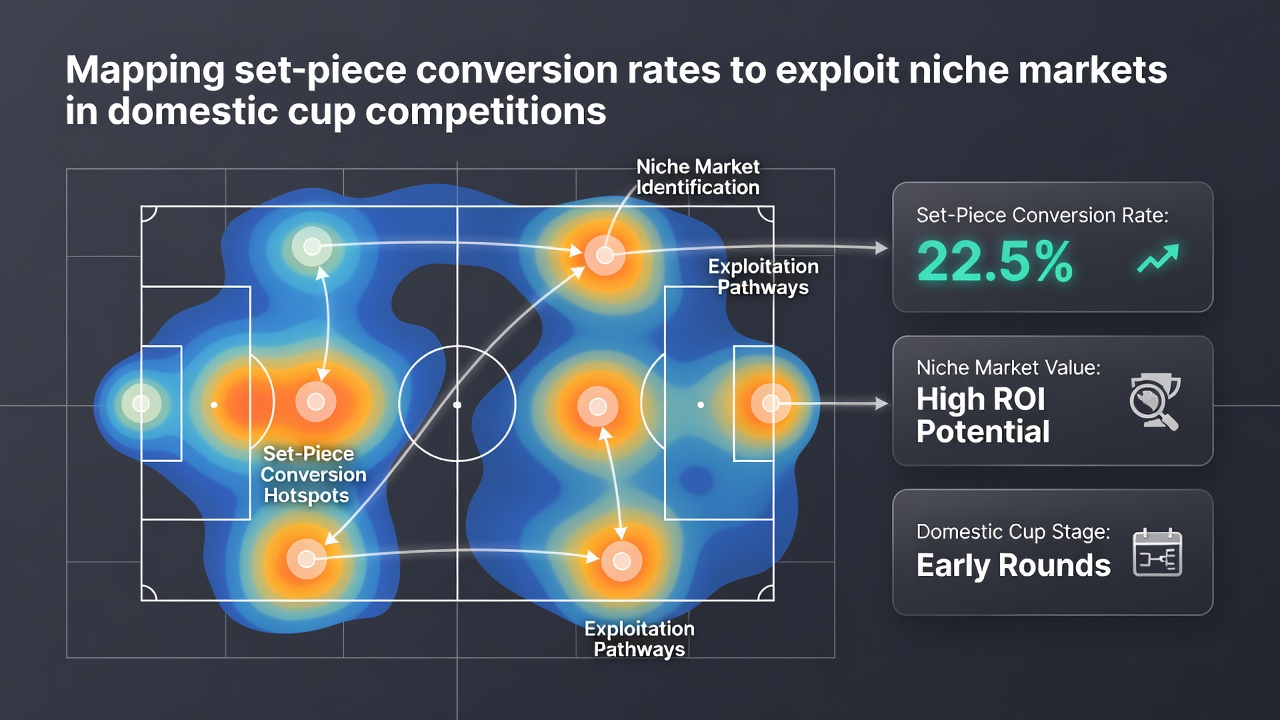
Bookmakers adjust lines for set-piece related props more slowly in cup competitions than in league schedules, partly because the fixture calendar produces fewer comparable matches. This lag allows mapped data to surface discrepancies between expected and offered odds on outcomes such as first set-piece goal or total corners before half-time. Bettors who segment results by round, team motivation, and historical conversion percentages locate pockets where implied probabilities diverge from recorded frequencies.
One study released by the Canadian Sport Institute examined how dead-ball efficiency shifts across cup formats and found consistent overperformance by mid-table sides in single-elimination scenarios. Such findings feed into accumulator constructions that combine set-piece goal timing with broader match totals, particularly when lineups confirm the presence of specialist takers or target forwards.
Practical Application of Conversion Maps
Practitioners build layered models that weight recent cup form against season-long set-piece metrics, adjusting for opponent quality and rest intervals. These models flag matches where a favorite's set-piece weakness aligns with an underdog's delivery strength, producing value in both win-draw-win and alternative handicap markets. Because cup draws often pair mismatched resources, the resulting variance amplifies the impact of a single well-executed routine.
Tracking software now incorporates video tagging of delivery zones and defensive setups, which refines the accuracy of predicted conversion percentages. Analysts update these inputs weekly during active cup windows, ensuring maps reflect the latest personnel changes and tactical adjustments observed in prior rounds.
Conclusion
Set-piece mapping continues to supply granular insights that differentiate cup competitions from their league counterparts, and organizations maintain these datasets to monitor evolving efficiencies. As more competitions adopt advanced tracking and publish granular statistics, the resolution of such maps improves, sharpening the identification of niche opportunities tied to dead-ball outcomes. Those maintaining current records through June 2026 and beyond position themselves to recognize when historical patterns reappear under specific fixture conditions.