Referee Behavior Patterns Reshaping Card Betting Markets in Major Fixtures
Leon Becker · Aug 16, 2026

Referee Behavior Patterns Reshaping Card Betting Markets in Major Fixtures
High-stakes fixtures often see card markets move sharply once referee assignments drop, and analysts track historical patterns that explain those shifts. Data from European competitions shows certain officials issue yellow cards at rates 15 to 25 percent above league averages when matches carry knockout implications or title implications. Those figures come from aggregated match logs compiled across multiple seasons and they highlight how experience levels and regional backgrounds correlate with stricter enforcement in pressure situations.
Historical Data Sets Reveal Consistent Tendencies
Researchers who examined over 4,000 matches between 2020 and 2025 found that referees from southern European leagues handed out more cards in away-team heavy environments while northern officials showed steadier rates regardless of venue. The differences emerge most clearly in games where one side leads by a single goal late on, and betting operators adjust lines accordingly once they review those profiles. August 2026 fixtures already list several officials whose recent assignments produced elevated card counts in Champions League qualifiers, prompting early line adjustments in both pre-match and live markets.
Key Variables That Influence Card Volume
Match intensity combines with referee age and prior appointments to shape outcomes, while crowd size adds another measurable layer. Studies conducted by academic groups at institutions across Europe indicate that referees under 40 issue fewer cards in the first half yet increase their rate after the break when fatigue sets in among players. Temperature and pitch conditions also register in the models, though their impact registers smaller than personality-driven factors. Observers note that officials who previously worked in lower divisions sometimes carry stricter thresholds into elite games, creating spikes that markets price in advance.
Those patterns help explain why card totals in certain derbies exceed projections even when team styles suggest cleaner contests. Data shows the referee's average cards per 90 minutes rises when the fixture features two teams separated by fewer than three points in the table, and operators incorporate that variable into their algorithms.
Regional Styles and Their Market Effects
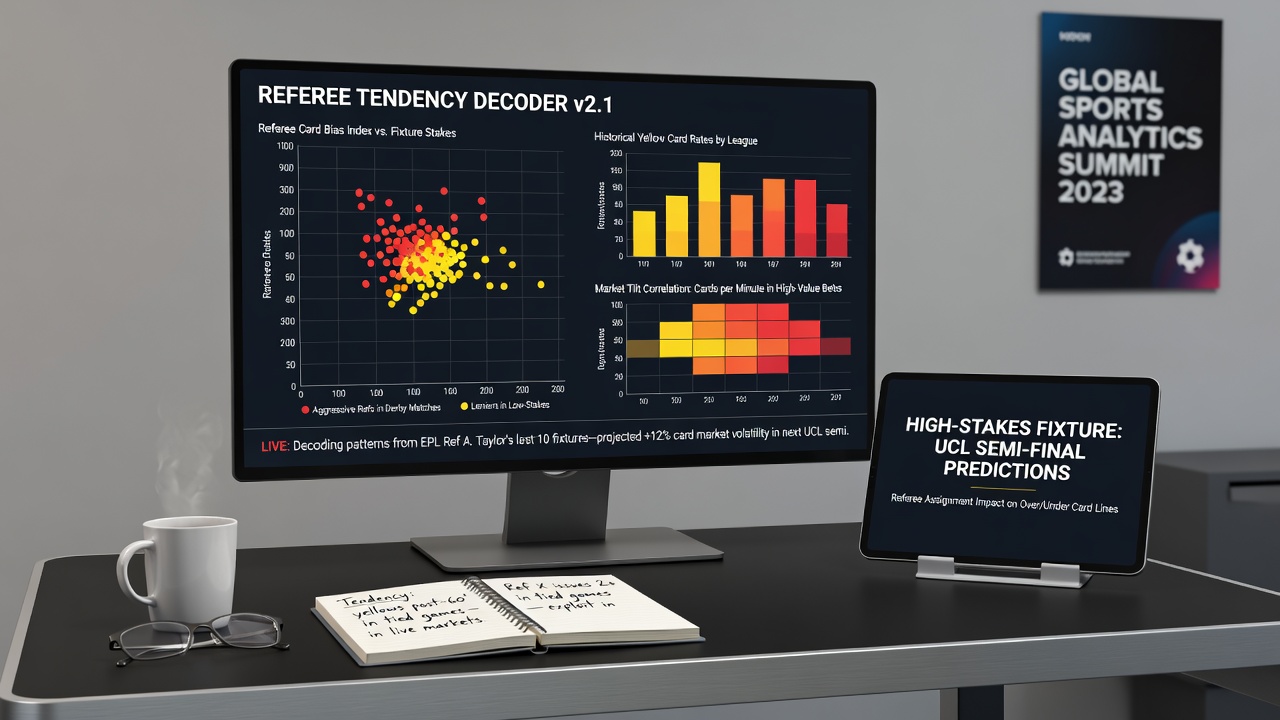
Officials trained in leagues with physical styles tend to tolerate more contact early, yet tighten up once the scoreline tightens. A report published by the FIFA Technical Study Group examined referee performance across confederations and noted measurable differences in sanction rates between South American and Asian officials when both groups handled European club competitions. Those variations create opportunities for markets that track individual assignments rather than relying on league-wide averages. Australian researchers tracking similar metrics through national sports data repositories reached parallel conclusions about how cultural training backgrounds translate into card frequency.
High-profile matches scheduled for late August 2026 already feature several referees whose recent card averages sit above expected benchmarks, and bookmakers have responded by shading lines lower on unders. The adjustments reflect compiled data rather than speculation, and they demonstrate how transparent referee statistics now feed directly into pricing models.
Live Market Reactions and In-Game Adjustments
Once a game begins, card markets respond quickly to early decisions that confirm or contradict historical profiles. A referee who typically issues three yellows before half-time but starts with none may see over lines drift as bettors interpret the change as a signal of leniency. Conversely, an early card from an official known for restraint often triggers rapid movement on totals because markets anticipate compensation later. Tracking software used by professional syndicates flags these deviations within seconds, and the resulting price shifts create short windows for informed entries.
Teams that press high or commit tactical fouls in midfield also interact with referee tendencies, and data sets now break down card locations by zone. Central areas produce more sanctions across most profiles, yet some officials show elevated rates near the touchlines when players engage in time-wasting. Those granular figures allow more precise modelling of expected totals once lineups and formations become available.
Conclusion
Card markets in high-stakes fixtures continue to evolve as more detailed referee data enters public and proprietary models. Patterns tied to experience, region, and match context provide measurable edges when operators and bettors incorporate them systematically. August 2026 fixtures will supply fresh examples, and ongoing collection of match logs should refine the accuracy of those projections further.