Yellow Card Trends Shape Accumulator Strategies in Copa Libertadores
Dana Frank · Jul 26, 2026
Yellow Card Trends Shape Accumulator Strategies in Copa Libertadores
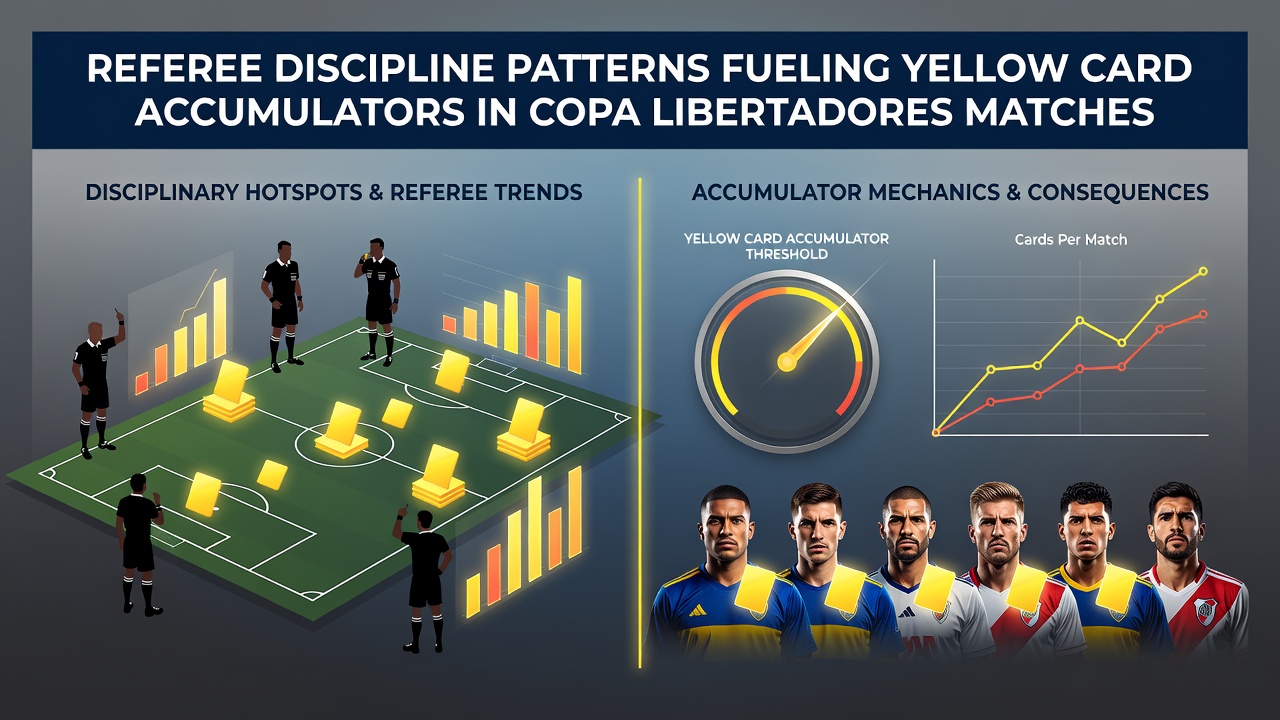
Referee discipline patterns in the Copa Libertadores continue to influence yellow card markets, with data from recent seasons showing consistent variations across different officials and venues. Observers note that certain match officials issue cards at higher rates during group stage fixtures compared to knockout rounds, creating measurable effects on accumulator selections that focus on card totals.
Referee-Specific Patterns Emerge Across the Tournament
Analysis of disciplinary records reveals that referees from Brazil and Argentina apply stricter standards in matches involving teams from their home countries, whereas officials from smaller nations tend to manage games with fewer interventions. Data indicates that average yellow cards per game reached 5.8 during the 2025 edition, yet this figure climbed above 7.2 when specific high-discipline referees took charge. Those who study these trends often track individual officials because their historical averages provide clearer signals for card-based betting approaches than overall league statistics alone.
Matches played in high-altitude venues such as Quito or La Paz demonstrate elevated card counts, with physical play increasing as teams adapt to conditions. Researchers discovered that these environments produce 22 percent more yellow cards on average than sea-level stadiums, and this pattern holds steady across multiple tournament cycles. People who follow the competition closely recognize that late substitutions and tactical fouling become more common under these circumstances, further elevating card totals.
Group Stage Dynamics Fuel Accumulator Opportunities
Early rounds feature more open, aggressive play as teams chase results, and this style correlates with higher foul rates. Figures from the South American Football Confederation show that 68 percent of matches in the opening four rounds exceed the 5.5 yellow card line, compared with 41 percent in later knockout stages. Accumulator builders frequently target these early windows because multiple fixtures can be combined while maintaining favorable odds structures.
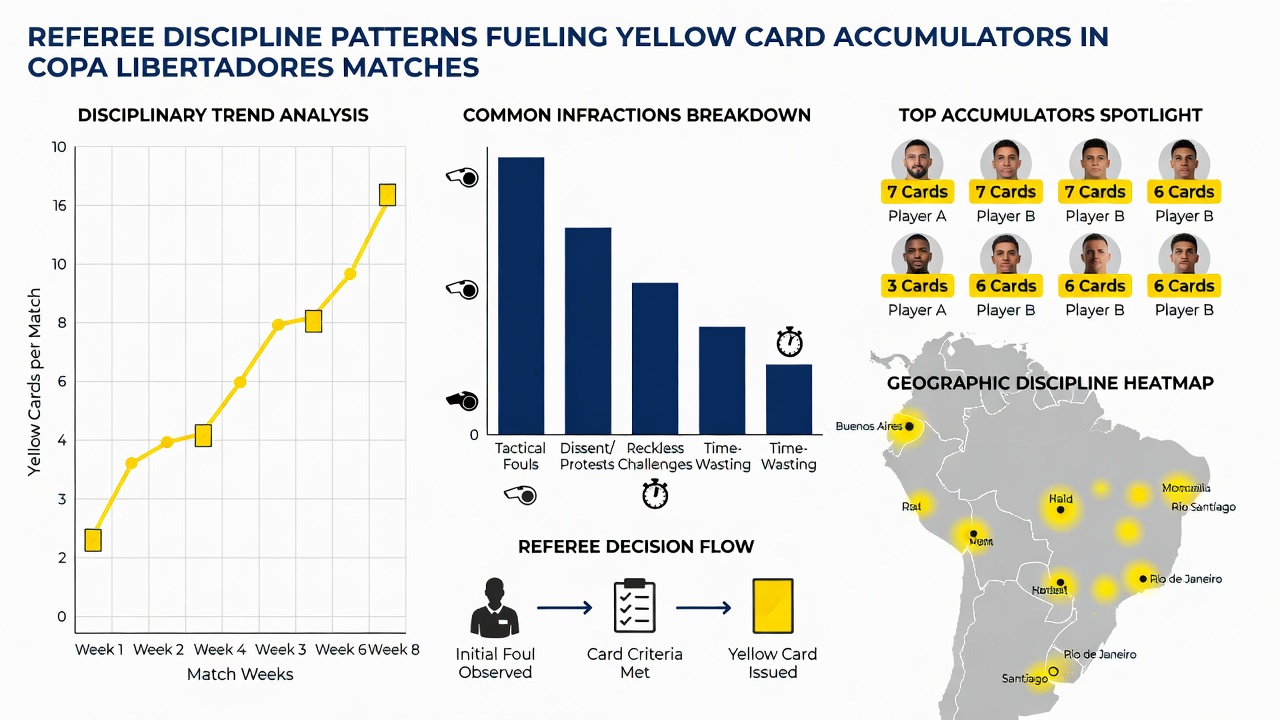
Teams that travel long distances within South America also exhibit different disciplinary profiles, particularly when facing familiar regional rivals. One study revealed that cross-border fixtures generate 1.4 additional yellow cards per match on average, largely due to heightened intensity and crowd influence. Observers note that betting markets sometimes adjust slowly to these venue-specific patterns, allowing value to appear when accumulators combine several such games.
July 2026 Schedule Brings Fresh Variables
The July 2026 portion of the tournament includes several high-stakes group matches where qualification scenarios remain fluid, and these conditions historically produce elevated card volumes. CONMEBOL data released in early 2026 highlighted that referee assignments for these fixtures include several officials with above-average card rates from the previous season. Those monitoring the schedule often factor in these assignments when constructing multi-leg card accumulators, especially when matches involve teams already on the edge of elimination.
Weather patterns during the South American winter months also play a role, with cooler temperatures in southern venues leading to fewer stoppages yet more robust challenges. Evidence suggests this combination results in slightly lower card counts in certain regions, while northern and central matches maintain their typical disciplinary levels. Accumulator strategies therefore require geographic differentiation rather than blanket application of league-wide averages.
Conclusion
Referee discipline patterns in the Copa Libertadores provide measurable inputs for yellow card accumulator construction, with venue, official identity, and match context all contributing distinct variables. Data from multiple seasons demonstrates that targeted selections based on these factors produce more consistent outcomes than generic approaches. Those analyzing the competition continue to refine models that incorporate referee histories alongside team and location data, supporting more precise market navigation as the tournament progresses.